Capture a range of metrics from a single data set, with the flexibility to choose from our extensive library or work with us to develop new ones. We can tailor and configure metrics to meet the needs of your project and compliance requirements.
Rock Cover
Rock Cover measures the proportion of area occupied by large rocks within an area, which can be configured to include rock mulch or continuous sheets of rock. Rock Cover can be used to compare the rehabilitation effort to completion criteria. Additionally, it can be used to define areas which are likely to be stable.
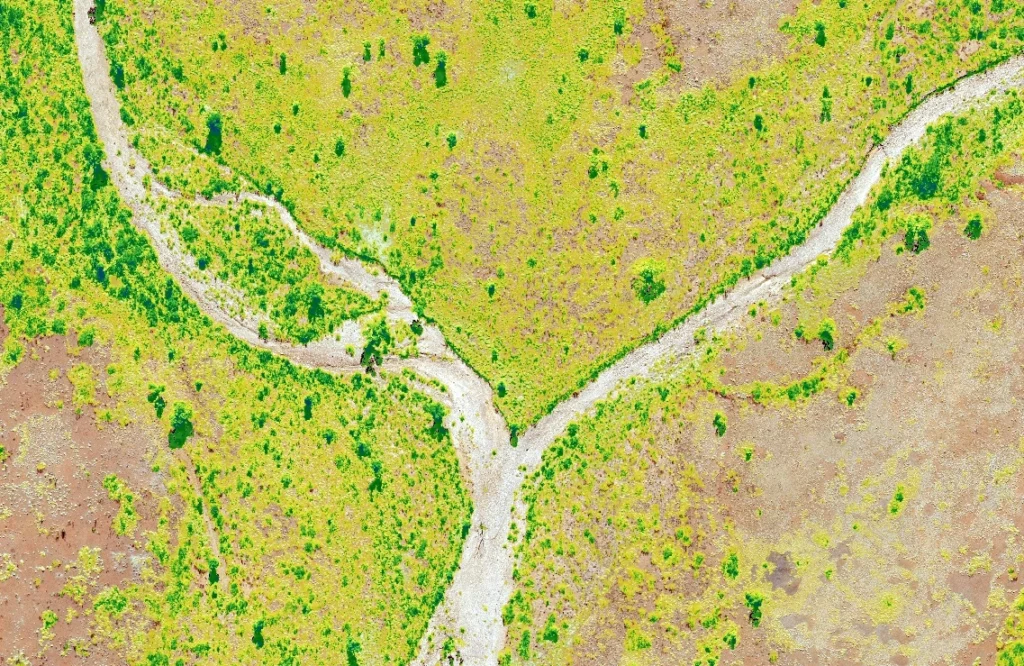
Gully Cover
Gully Cover identifies areas where soil removal due to surface water runoff has caused channels to form. Gully Cover can be used to identify areas of landform instability and where loss of soil material is likely to be impacting on vegetation and habitat establishment. Gully Cover can also be used to identify areas where encapsulated materials are at risk of exposure.
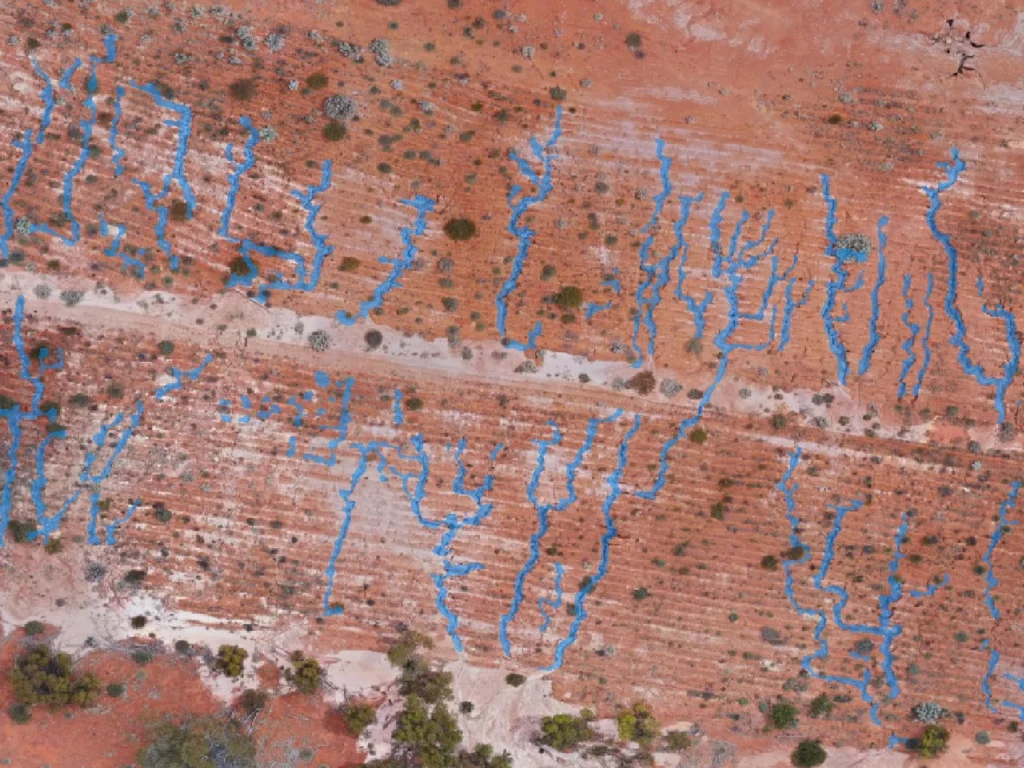
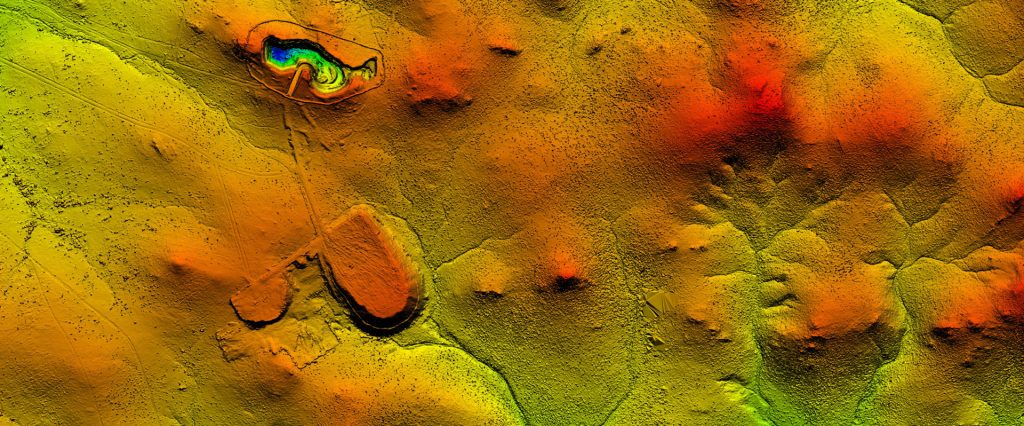
Gully Spacing
Gully Spacing is a calculation of the distance between gully features perpendicular to the slope. Gully Spacing can be used to identify areas of landform instability and where loss of soil material is likely to be impacting on vegetation and habitat establishment. Gully Spacing can also be used to assess actual landform stability against modelled performance (such as SIBERIA or WEPP modelling).
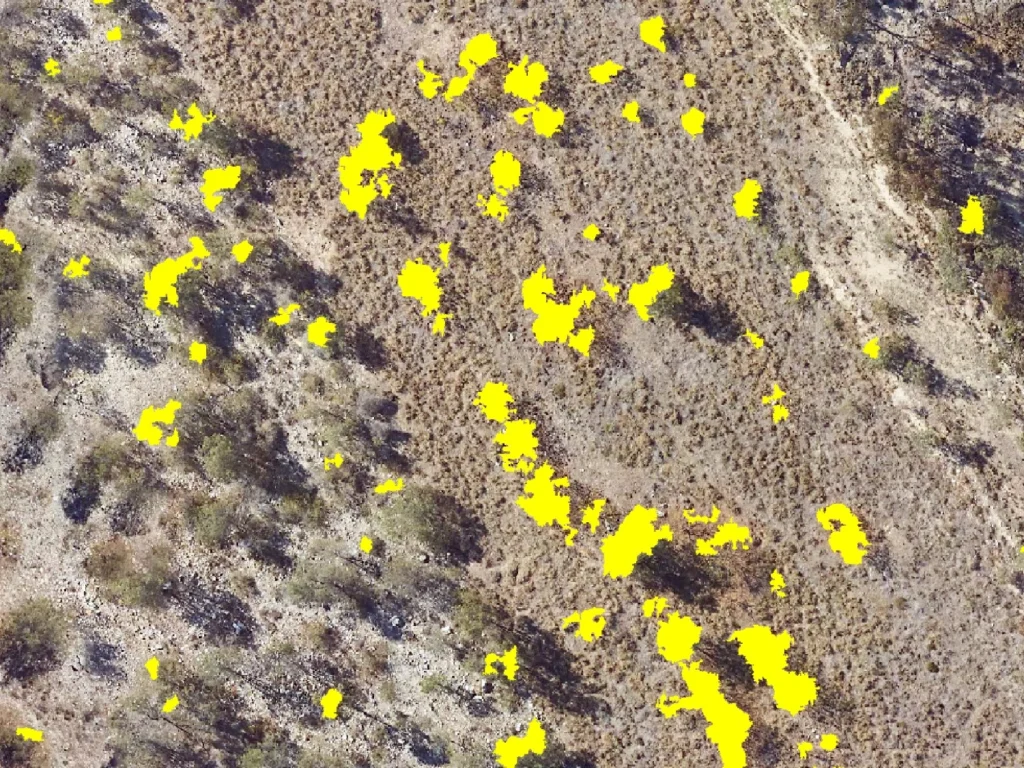
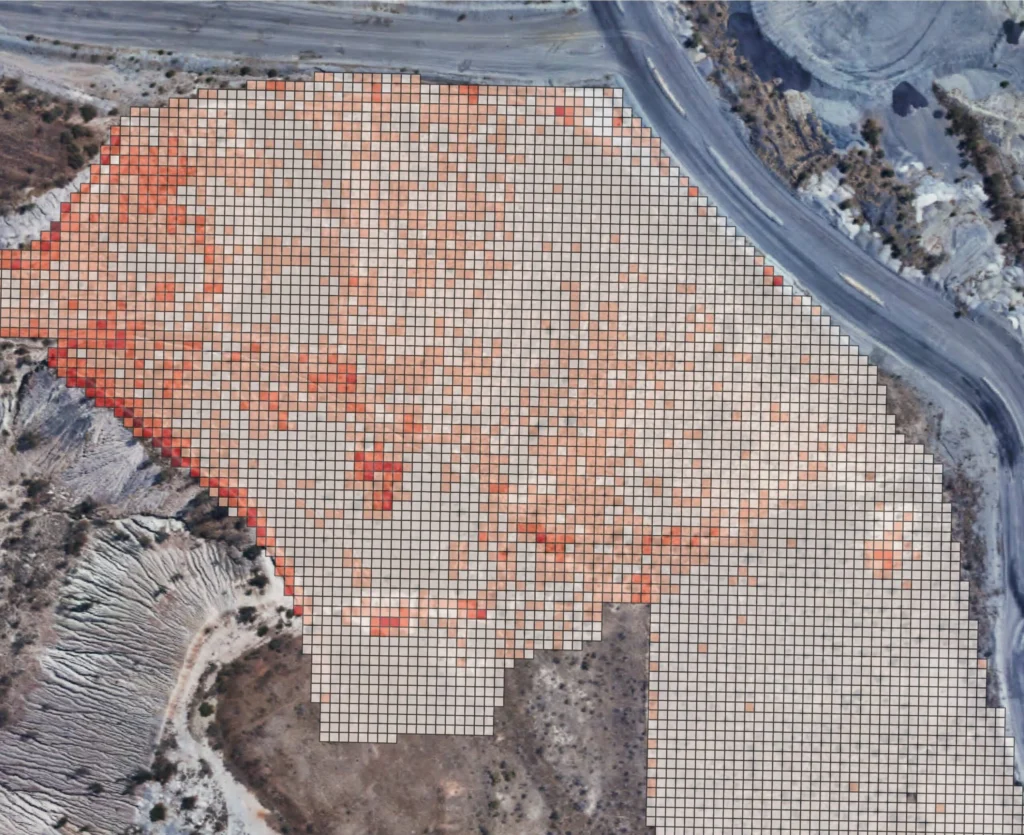
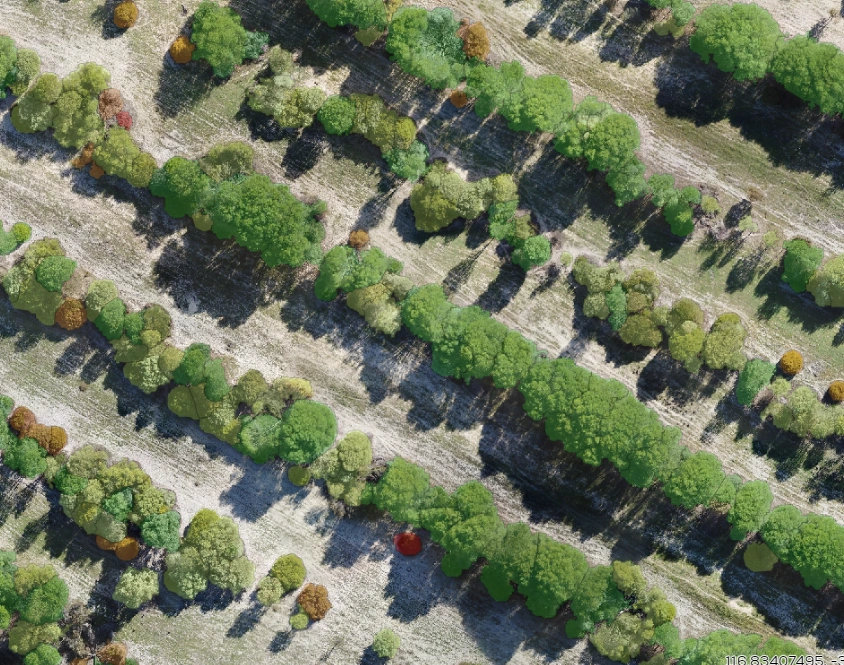
Flora Species Detection
Significant time and resources can be exhausted through the manual on-ground searching for plant species, such as weeds or declared rare flora. Flora species detection uses machine learning algorithms applied to high resolution imagery to identify and map the density and distribution of target species. This information is then used to optimise in-field search campaigns, weed management activities and monitor changes in occurrence over time.
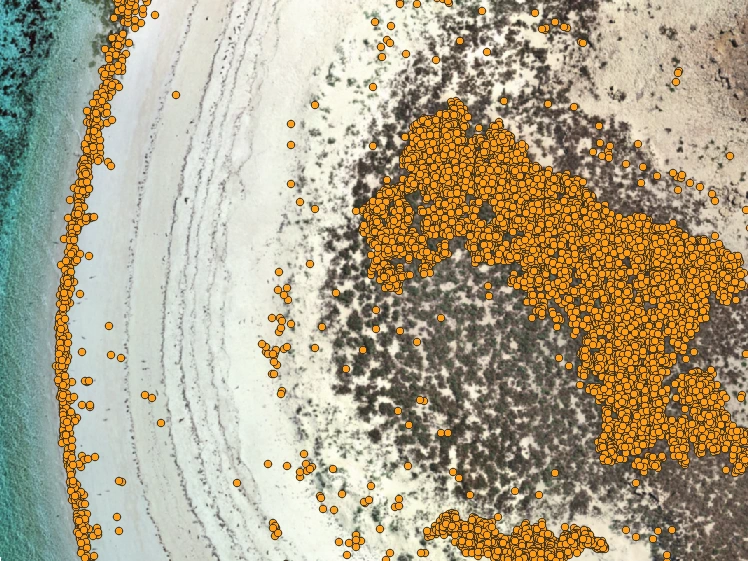
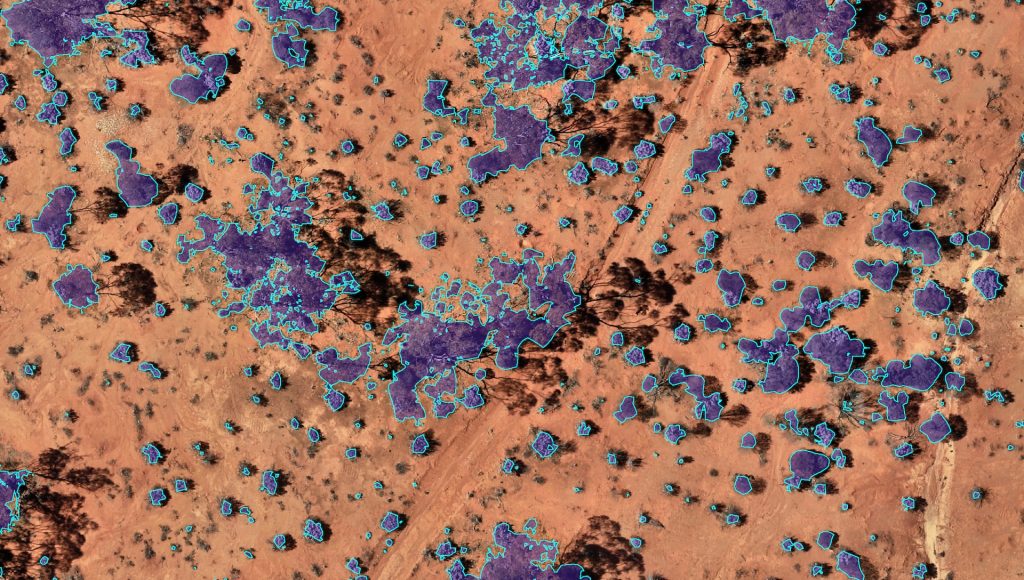
Fauna Species Detection
Significant time and resources are required to survey for some fauna species. In addition, some fauna species are easily disturbed by human observers. Fauna species detection uses deep learning algorithms applied to high resolution imagery to identify target species such as seabirds and macropods. Quantification is automated, animal densities mapped and changes in abundance monitored over time.
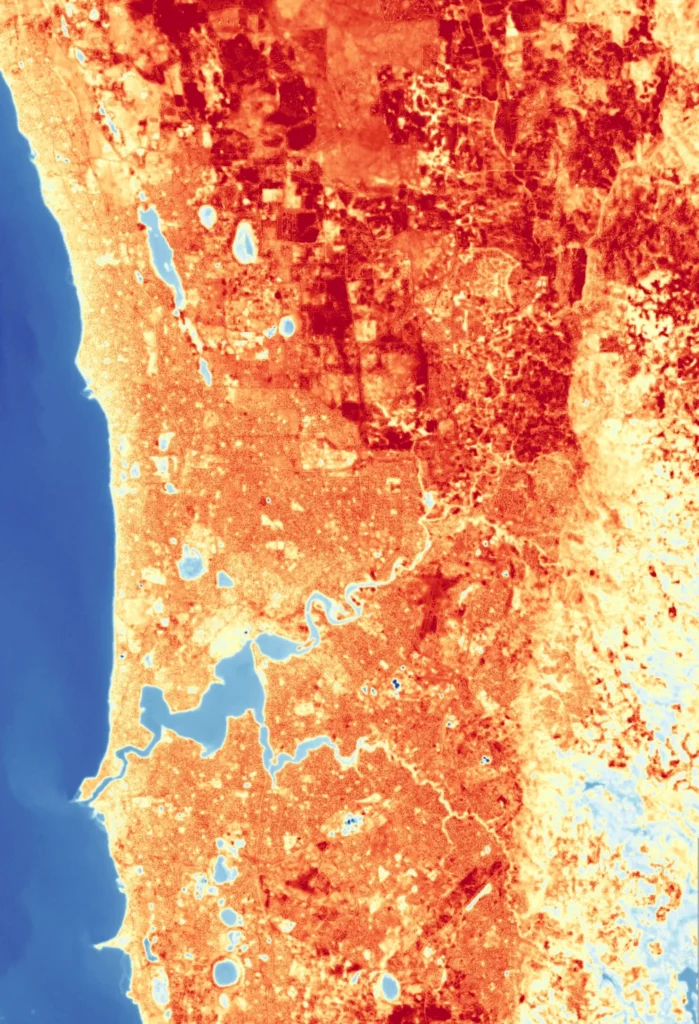
Land Surface Temperature
Land Surface Temperature is determined by considering a timeseries of thermal data. Land Surface Temperature can indicate areas which have undergone land use changes, identify heat islands in urban areas and show climatic patterns for broadscale areas.
Grass Cover
Grass Cover accurately quantifies the amount of grass cover over large areas, which can be determined spectrally or by evaluating elevation data. Measures of Grass Cover can convey information relating to the ecological services likely to be available within an area based on vegetation stratification. Grass Cover can be compared to analogue sites to determine if the stratification profile provides a similar function as the analogue sites. Additionally, time series of grass cover can be used to evaluate the succession of an area following events of disturbance.
Vegetation Height
Vegetation Height is the vertical height of identified plants. It can be used to assess the cover of vegetation in different height classes (such as upper, mid and lower storey). Rehabilitation areas can be compared with surrounding or analogue vegetation to determine if the vegetation structure is similar and if fauna habitat is being returned. With repeat measures the change in vegetation height can be used as an indicator of vegetation dynamics.
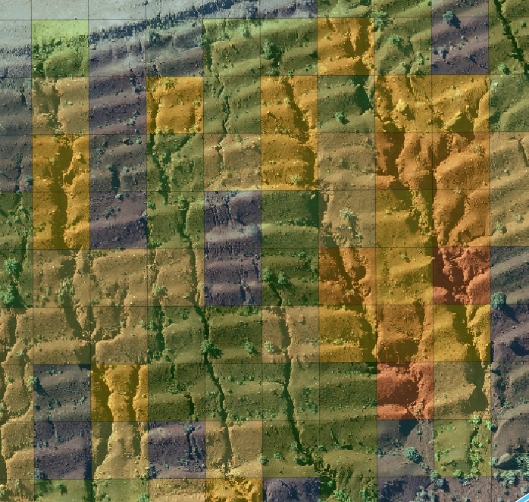
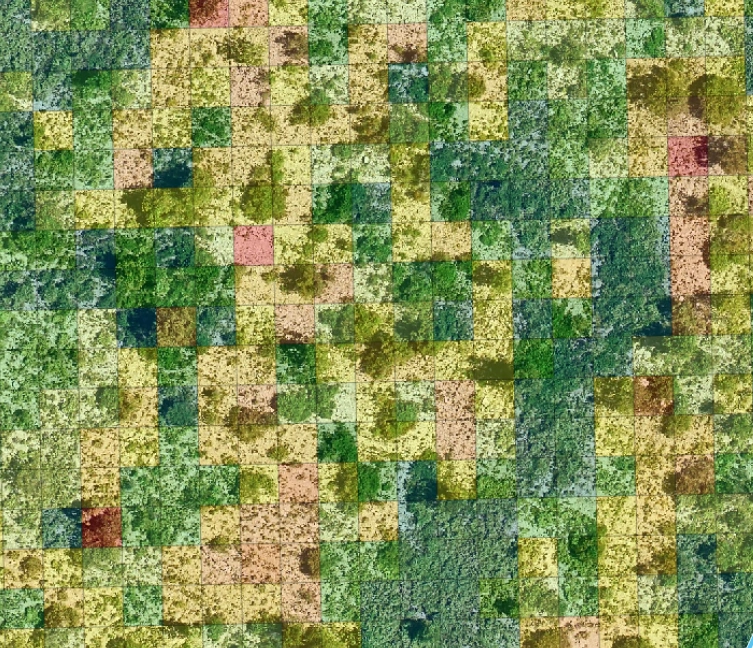
Vegetation Health
Vegetation Health provides an accurate and quantified relative measure of vegetation condition. Vegetation Health can be used to identify areas of vegetation stress that may be caused by factors such as sedimentation and soils with poor physical or chemical properties. Expanded into a time-series, Vegetation Health can be used to monitor health changes over time.
Submit an online enquiry